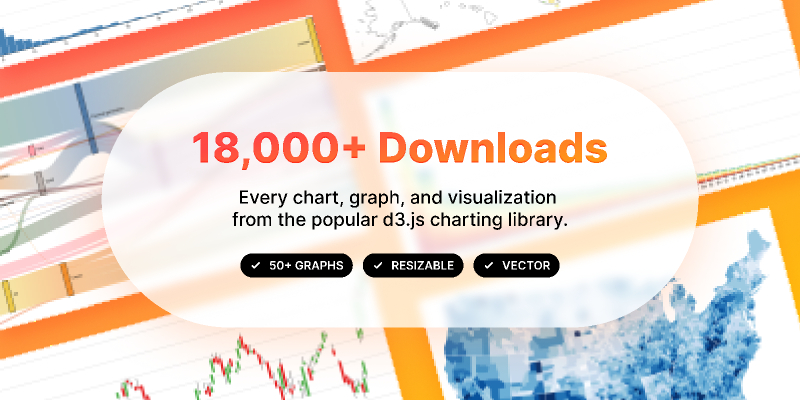
Figma Freebie Charts, Graphs, and Visualizations
2022-10-19 13:30:34
Related tags
Figma Freebie Charts, Graphs, and Visualizations.
Available Chart Types:
- Calendar Heatmap
- Arc Diagram
- Change Over Time Heatmap Diagram
- Bubble Map
- Bar Chart (vertical and horizontal)
- Candlestick Chart
- Choropleth (mono-color and multi-color)
- Area (stacked, normalized, streamgraph)
- Beeswarm
- Gradient Encoding
- Hexbin
- Grouped Bar
- Global Temperature Trend
- Contours
- Income Inequality
- Force Directed
- Dot Plot
- Horizon Chart
- Herzsprung-Russel Diagram
- Moon Phases
- Pie Chart
- Donut Chart
- Normal Quantile Plot
- Q-Q Plot
- Parallel Sets
- Parallel Coordinates
- Radial Area Chart
- Marimekko Chart
- Line Chart
- Power Consumption Over Time
- Stacked Bar
- Threshold Encoding
- Slope Chart
- Sankey Diagram
- Stern-Brocot Tree
- Spike Map
- Ridgeline Plot
- Scatterplot
- Star Map
- Radial Stacked Bar Chart
- Tourists
- Variable Color Line
- United States of America
- World History Timeline
- Train Schedule

Author: Jon Moore
Free license: Licensed under CC BY 4.0
File type: Figma
Report resource
Edit Telmplate